EE-Unit-II Acid Rain

“Acid Rain,”  or more precisely acid precipitation, is the word used to describe rainfall that has a pH level of less than 5.6.  This form of air pollution is currently a subject of great controversy because of it’s worldwide environmental damages. Acid rain is formed when oxides of nitrogen and sulfite combine with moisture in the atmosphere to make nitric and sulfuric acids.  These acids can be carried away far from its origin.  This report contains the causes, effects, and solutions to acid rain.

     The two primary sources of acid rain are sulfur dioxide (SO2), and oxides of nitrogen (NOx).  Sulfur dioxide is a colourless, prudent gas released as a by-product of combusted fossil fuels containing sulfur.  A variety of industrial processes, such as the production of iron and steel, utility factories, and crude oil processing produce this gas.  In iron and steel production, the smelting of metal sulfate ore, produces pure metal. This causes the release of sulfur dioxide.  Metals such as zinc, nickel, and copper are commonly obtained by this process.  Sulfur dioxide can also be emitted into the atmosphere by natural disasters or means.  This ten percent of all sulfur dioxide emission comes from volcanoes, sea spray, plankton, and rotting vegetation.  Overall, 69.4 percent of sulfur dioxide is produced by industrial combustion.  Only 3.7 percent is caused by transportation

     The other chemical that is also chiefly responsible for the make-up of acid rain is nitrogen oxide.  Oxides of nitrogen is a term used to describe any compound of nitrogen with any amount of oxygen atoms.  Nitrogen monoxide and nitrogen dioxide are all oxides of nitrogen.  These gases are by-products of firing processes of extreme high temperatures (automobiles, utility plants), and in chemical industries (fertilizer production).  Natural processes such as bacterial action in soil, forest fires, volcanic action, and lightning make up five percent of nitrogen oxide emission.  Transportation makes up 43 percent, and 32 percent belongs to industrial combustion.  [“Acid Rain.”  The New World Book Encyclopedia.  1993.]

     Nitrogen oxide is a dangerous gas by itself.  This gas attacks the membranes of the respiratory organs and increases the likelihood of respiratory illness.  It also contributes to ozone damage, and forms smog.  Nitrogen oxide can spread far from the location it was originated by acid rain.

     As mentioned before, any precipitation with a pH level less than 5.6 is considered to be acid rainfall.  The difference between regular precipitation and acid precipitation is the pH level.  pH is a symbol indicating how acidic or basic a solution is in ratios of relative concentration of hydrogen ions in a solution.  A pH scale is used to determine if a specific solution is acidic or basic.  Any number below seven is considered to be acidic.  Any number above seven is considered to be basic.  The scale is color coordinated with the pH level.  Most pH scales use a range from zero to fourteen.  Seven is the neutral point (pure water).  A pH from 6.5 to 8, is considered the safe zone.  Between these numbers, organisms are in very little or no harm.

     Not only does the acidity of acid precipitation depend on emission levels, but also on the chemical mixtures in which sulfur dioxide and nitrogen oxides interact in the atmosphere.  Sulfur dioxide and nitrogen oxides go through several complex steps of chemical reactions before they become the acids found in acid rain.  The steps are broken down into two phases, gas phase and aqueous phase.  There are various potential reactions that can contribute to the oxidation of sulfur dioxide in the atmosphere each having varying degrees of success.  One possibility is photooxidation of sulfuric dioxide by means of ultraviolet light.  This process uses light form the of electromagnetic spectrum.  This causes the loss of by two oxygen atoms.  This reaction was found to be an insignificant contributor to the formation of sulfuric acid.  A second and more common process is when sulfur dioxide reacts with moisture found in the atmosphere.  When this happens, sulfate dioxide immediately oxidizes to form a sulfite ion.

SO2 (g)+O2(g) -> SO3(g)

Afterwards, it becomes sulfuric acid when it joins with hydrogen atoms in the air.

SO3(g)+H2O(l) -> H2SO4(aq)

     This reaction occurs quickly, therefore the formation of sulfur dioxide in the atmosphere is assumed to lead this type of oxidation to become sulfuric acid.  Reaction example 1 (photooxidation), is slow due to the absence of a catalyst, proving why it is not a significant contributor.

     Another common reaction for sulfur dioxide to becomes sulfuric acid is by oxidation by ozone.  This reaction occurs at a preferable rate and is sometimes the main contributor to the oxidation of sulfuric acid.  This, hydroxy radical is produced by the photodecomposition of the ozone and is very highly reactive with any species (type of chemical compounds).  It does not require a catalyst and it is approximately 108-109 times more abundant in the atmosphere than molecular oxygen.  Other insignificant reactions include oxidation by product of alkene-zone reactions, oxidation by reaction of NxOy species, oxidation by reactive oxygen transients, and oxidation by peroxy radicals.  These reactions unfortunately prove to be insignificant for various reasons.  All the reactions mentioned so far, are gas phase reactions.  In  the aqueous phase, sulfur dioxide exists as three species:

[S(IV)] -> [SO2(aq)] + [HSO32-] + [SO32-]

This dissociation occurs in a two part process:

SO2(aq) -> H+ + HSO3 –

HSO3-   (aq) -> H+  + SO32-

     The oxidation process of aqueous sulfur dioxide by molecular oxygen relies on metal catalyst such as iron and manganese.  This reaction is unlike other oxidation process, which occurs by hydrogen peroxide.  It requires an additional formation of an intermediate (A-), for example peroxymonosulfurous acid ion.  This formation is shown below.

HSO3  H2O2 -> A-  +H2O

A-  +H  -> H2SO4

     Sulfur dioxide oxidation is most common in clouds and especially in heavily polluted air where compounds such as ammonia and ozone are in abundance.  These catalysts help convert more sulfur dioxide into sulfuric acid.   But not all of the sulfur dioxide is converted to sulfuric acid.  In fact, a substantial amount can float up into the atmosphere, transport to another area and return to earth unconverted.

     Like sulfur dioxide, nitrogen oxides rise into the atmosphere and are oxidized in clouds to form nitric or nitrous acid.  These reactions are catalyzed in heavily polluted clouds where traces of iron, manganese, ammonia, and hydrogen peroxide are present.  Nitrogen oxides rise into the atmosphere mainly from automobile exhaust.  In the atmosphere it reacts with water to form nitric or nitrous acid.

NO2(g) + H2O(l) -> HNO3(aq)+HNO2(aq)  [gas phase]

In the aqueous phase there are three equilibria to keep in mind for the oxidation of nitrogen oxide.

1.)  2NO2(g) + H2O(l) -> 2H+ + NO3 –  + NO2 –
2.)  NO(g) + NO2(g) + H2O(l) -> 2H+  + 2NO2 –
3.)  3NO2(g) + H2O(l) -> 2H+  + 2NO3 –  + NO(g)

     These reactions are limited by the partial pressures of nitrogen oxides present in the atmosphere, and the low solubility of nitrogen oxides, increase in reaction rate occurs only with the use of a metal catalyst, similar to those used in the aqueous oxidation of sulfur dioxide.

     Over the years, scientists have noticed that some forests have been growing more and more slowly without reason.  Trees do not grow as fast as they did before.  Leaves and pines needles turn brown and fall off when they are supposed to be green.

     Eventually, after several years of collecting and recording information on the chemistry and biology of the forest, researchers have concluded that this was the work of acid rain.  A rainstorm occurs in a forest.  The summer spring washes the leaves of the branches and fall to the forest floor below.  Some of the water is absorbed into the soil.  Water run-off enters nearby streams, rivers, or lakes.  That soil may have neutralized some or all of the acidity of the acid rainwater.  This ability of neutralization is call buffering capacity.  Without buffering capacity, soil pH would change rapidly.  Midwestern states like Nebraska and Indiana have soil that is well buffered.  Nonetheless, mountainous northwest areas such as the Adirondack mountains are less able to buffer acid.  High pH levels in the soil help accelerate soil weathering and remove nutrients.  It also makes some toxic elements, for example aluminum, more soluble.  High aluminum concentrations in soil can prevent the use of nutrients by plants.  Acid rain does not kill trees immediately or directly.  Instead, it is more likely to weaken the tree by destroying its leaves, thus limiting the nutrients available to it.  Or, acid rain can seep into the ground, poisoning the trees with toxic substances that are slowly being absorbed through the roots.  When acid rain falls, the acidic rainwater dissolves the nutrients and helpful minerals from the soil.  These minerals are then washed away before trees and other plants can use them to grow.  Not only does acid rain strip away the nutrients from the plants, they help release toxic substance such as aluminum into the soil.  This occurs because these metals are bound to the soil under normal conditions, but the additional dissolving action of hydrogen ions causes rocks and small bound soil particles to break down.  When acid rain is frequent, leaves tend to lose their protective waxy coating,  When leaves lose their coating, the plant itself is open to any possible disease.  By damaging the leaves, the plant can not produce enough food energy for it to remain healthy.  Once the plant is weak, it can become more vulnerable to disease, insects, and cold weather which may ultimately kill it.

     Acid rain does not only effect organisms on land, but also effect organisms in aquatic biomes.  Most lakes and streams have a pH level between six and eight.  Some lakes are naturally acidic even without the effects of acid rain.  For example, Little Echo Pond in New York has a pH level of 4.2.

     There are several routes through which acid rain can enter the lakes.  Some chemical substances exist as dry particles in the atmosphere, while others enter directly into the lake in a form of precipitation.  Acid rain that has fallen on land can be drained through sewage systems leading to lakes.  Another way acids can enter the lake is by spring acid shock.  When acid snow melts in the spring, the acids in the snow seeps into the ground.  Some run-off the ground and into lakes.

     Spring is a vulnerable time for many species since this is the time for reproduction.  The sudden change in pH level is dangerous because the acid can cause serious deformities in their young.  Generally, the young of most species are more sensitive than the elders.  But not all species can tolerate the same amount of acid.  For example, frogs may tolerate relatively high levels of acidity, while snails are more sensitive to pH changes.

     Sulfuric acid in polluted precipitation interferes with the fish’s proficiency to take in oxygen, salt, and nutrients.  For freshwater fish, maintaining osmoregulation (the ability to maintain a state of balance between salt and minerals in the organism’s tissue) is essential to stay alive.  Acid molecules cause mucus to form in their gills preventing the fish to absorb oxygen well.  Also, a low pH level will throw off the balance of salt in the fish’s tissue.  Calcium levels of some fish cannot be maintained due to the changes in pH level.  This causes a problem in reproduction: the eggs are too brittle or weak.  Lacking calcium causes weak spines and deformities in bones.  Sometimes when acid rainfall runs off the land, it carries fertilizers with it.  Fertilizer helps stimulate the growth of algae because of the amount of nitrogen in it.  However, because of the increase in the death of fish the decomposition takes up even more oxygen.  This takes away from surviving fish.  In other terms, acid rain does not help aquatic ecosystems in anyway.

     Acid rain does not only damage the natural ecosystems, but also man-made materials and structures.  Marble, limestone, and sandstone can easily be dissolved by acid rain.  Metals, paints, textiles, and ceramic can effortlessly be corroded.  Acid rain can downgrade leather and rubber.  Man-made materials slowly deteriorate even when exposed to unpolluted rain, but acid rain helps speed up the process.  Acid rain causes carvings and monuments in stones to lose their features.

In limestone, acidic water reacts with calcium to form calcium sulfate.

CaCO3 + H2SO4 -> CaSO4 +  H2CO3

For iron, the acidic water produces an additional proton giving iron a positive charge.

4Fe(s) + 2O2(g) + 8  (aq) -> 4Fe2+  (aq) + 4H2O(l)

When iron reacts with more oxygen it forms iron oxide (rust).

4Fe2+ + (aq) + O2(g) + 4H2O(l) -> 2Fe2O3(s) + 8H+ + (aq)

     Most importantly, acid rain can affect health of a human being.  It can harm us through the atmosphere or through the soil from which our food is grown and eaten from.  Acid rain causes toxic metals to break loose from their natural chemical compounds. Toxic metals themselves are dangerous, but if they are combined with other elements, they are harmless.  They release toxic metals that might be absorbed by the drinking water, crops, or animals that human consume.  These foods that are consumed could cause nerve damage to children or severe brain damage or death.  Scientists believe that one metal, aluminum, is suspected to relate to Alzheimer’s disease.

     One of the serious side effects of acid rain on human is respiratory problems.  The sulfur dioxide and nitrogen oxide emission gives risk to respiratory problems such as dry coughs, asthma, headaches, eye, nose, and throat irritation.  Polluted rainfall is especially harmful to those who suffer from asthma or those who have a hard time breathing.  But even healthy people can have their lungs damaged by acid air pollutants.  Acid rain can aggravate a person’s ability to breathe and may increase disease which could lead to death.

     In 1991, the United States and Canada signed an air quality agreement.  Ever since that time, both countries have taken actions to reduce sulfur dioxide emission.  The United States agree to reduce their annual sulfur dioxide emission by about ten million tons by the year 2000.  A year before the agreement, the Clean Air Pact Amendment tried to reduce nitrogen oxide by two million tons.  This program focused on the source that emits nitrogen oxide, automobiles and coal-fired electric utility boilers.

     Reducing nitrogen oxide emission in a utility plant starts during the combustion phase.  A procedure called Overfire Air is used to redirect a fraction of the total air in the combustion chamber. This requires the combustion process, which is redirected to an upper furnace.  This causes the combustion to occur with less O2 than required, thus slowing down the transformation of atmospheric nitrogen to nitrogen oxide.  After combustion, a system of catalytic reductions are put into effect.  This system embraces the injection of ammonia gas upstream of the catalytic reaction chamber.  The gas will react with nitrogen oxide by this reaction.

4NO + 4NH3 + O2 -> 4N2+6H2O

Then it will react with NO2 by the following reaction.

2NO2 + 4NH3 + O2 -> 3N2 + 6H2O

The safe nitrogen can be released into the atmosphere.

     Since most nitrogen oxide emissions are from cars, catalytic converters must be install on cars to reduce this emission.  The catalytic converter is mounted on the exhaust pipe, forcing all the exhaust to pass though it.  This converter looks like a dense honeycomb, but it is coated with either platimun, palladium, or rhodium.  This converts nitrogen oxides, carbon dioxides and unburned hydrocarbons into a cleaner state.

     To reduce sulfur dioxide emission utility plants are required to do several steps  by the Clean Air Act Amendment.  Before combustion, these utilities plants have to go through a process call coal cleaning.  This process is performed gravitationally.  Meaning, it is successful in removing pyritic sulfur due to its high specific gravity, but it is unsuccessful in removing chemically bound organic sulfur.  This cleaning process is only limited by the percent of pyritic sulfur in the coal.  Coal with high amount of pyritic sulfur is coal in higher demands.  Another way to reduce sulfur dioxide before combustion is by burning  coal with low sulfur content.  Low sulfur content coals are called subituminous coal.  This process in reducing sulfur dioxide is very expensive due to the high demand of subituminous coal.

     During combustion, a process called Fluidized Bed Combustion (FBC), is used to reduce sulfur dioxide emissions into the atmosphere. This process contains limestone or a sandstone bed that are crushed and diluted into the fuel. It is important that a balance is established between the heat liberated within the bed from fuel combustion, and the heat removed by the flue gas as it leaves.  Flue gas is the mixture of gases resulting from combustion and other reactions in a chamber.  This enables the limestones to react with sulfur dioxide and reduce emission by 90 percent.  After combustion, a process known as wet flue gas desulfurization is taken into action.  This process requires a web scrubber at the downward end of the boiler.  This process is very similar to FBC.  This scrubber can be made of either limestone or sodium hydroxide.  Limestone is more commonly used.  As sulfur dioxide enters this area it reacts with the limestone in the following example:

CaCO3 + SO2 + H2O + O2 -> CaSO3 + CaSO4 + CO2 + H2O

After being scrubbed, which is the term used for the phase after coal has past the wet scrubber, the flue gas is re-emmited and the waste solids are disposed.

     Acid rain is an issue that can not be over looked.  This phenomenon destroys anything it touches or interacts with it.  When acid rain damages the forest or the environment it affects humans in the long run.  Once forests are totally destroyed and lakes are totally polluted animals begin to decrease because of lack of food and shelter.  If all the animals, which are our food source, die out, humans too would die out.  Acid rain can also destroy our homes and monuments that humans hold dearly.

     What humans can do, as citizens, to reduce sulfur and nitrogen dioxide emission is to reduce the use of fossil fuels.  Car pools, public transportation, or walking can reduce tons of nitrogen oxide emissions.  Using less energy benefits the environment because the energy used comes from fossil fuels which can lead to acid rain.  For example, turning off lights not being used, and reduce air conditioning and heat usage.  Replacing old appliances and electronics with newer energy efficient products is also an excellent idea.  Sulfur dioxide emission can be reduced by adding scrubbers to utility plants.  An alternative power source can also be used in power plants to reduce emissions.  These alternatives are: geothermal energy, solar power energy, wind energy, and water energy.

     In conclusion, the two primary sources of acid rain is sulfur dioxide and nitrogen oxide.  Automobiles are the main source of nitrogen oxide emissions, and utility factories are the main source for sulfur dioxide emissions.  These gases evaporate into the atmosphere and then oxidized in clouds to form nitric or nitrous acid  and sulfuric acid.  When these acids fall back to the earth they do not cause damage to just the environment but also to human health.  Acid rain kills plant life and destroys life in lakes and ponds.  The pollutants in acid rain causes problem in human respiratory systems.  The pollutants attack humans indirectly through the foods they consumed.  They effected human health directly when humans inhale the pollutants.  Governments have passed laws to reduce emissions of sulfur dioxide and nitrogen oxide, but it is no use unless people start to work together in stopping the release of these pollutants.  If the acid rain destroys our environment, eventually it will destroy us as well.

EE-Unit-II Air Pollution Types and Sources

Air pollution occurs in many forms but can generally be thought of as gaseous and particulate contaminants that are present in the earth’s atmosphere. Gaseous pollutants include sulfur dioxide (SO2), nitrogen oxides (NOx), ozone (O3), carbon monoxide (CO), volatile organic compounds (VOC), hydrogen sulfide (H2S), hydrogen fluoride (HF), and various gaseous forms of metals. These pollutants are emitted from large stationary sources such as fossil fuel fired power plants, smelters, industrial boilers, petroleum refineries, and manufacturing facilities as well as from area and mobile sources. They are corrosive to various materials which causes damage to cultural resources, can cause injury to ecosystems and organisms, aggravate respiratory diseases, and reduce visibility.

Particulates come in both large and small or “fine” solid forms. Large particulates include substances such as dust, asbestos fibers, and lead. Fine particulates include sulfates (SO4) and nitrates (NO3). Important sources of particulates are power plants, smelters, mining operations, and automobiles. Asbestos and lead affect organisms, while sulfates and nitrates not only cause health problems, but also contribute to acid rain or acid deposition and a reduction in visibility. Particulate matter, a term sometimes used instead of particulates, refers to the mixture of solid particles and liquid droplets found in the air.

Toxic air pollutants are a class of chemicals which may potentially cause health problems in a significant way. The sources of toxic air pollutants include power plants, industries, pesticide application, and contaminated windblown dust. Persistent toxic pollutants, such as mercury, are of particular concern because of their global mobility and ability to accumulate in the food chain. More research is needed to fully understand the fate and effects of mercury and the many other toxic pollutants.

Primary pollutants are those that are emitted directly into the air from pollution sources. Secondary pollutants are formed when primary pollutants undergo chemical changes in the atmosphere. Ozone is an example of a secondary pollutant. It is formed when nitrogen oxides (NOx) and volatile organic compounds (VOCs) are mixed and warmed by sunlight. Ozone (O3) is a major component of what is often referred to as smog. The ozone which is present in the troposphere, or the atmosphere that is close to the ground, should not be confused with beneficial ozone that is located in the stratosphere or upper atmosphere. This beneficial ozone in the stratosphere helps protect the earth from harmful ultraviolet light from the sun.

Sources of Air Pollution

Stationary and Area Sources
A stationary source of air pollution refers to an emission source that does not move, also known as a point source. Stationary sources include factories, power plants, dry cleaners and degreasing operations. The term area source is used to describe many small sources of air pollution located together whose individual emissions may be below thresholds of concern, but whose collective emissions can be significant. Residential wood burners are a good example of a small source, but when combined with many other small sources, they can contribute to local and regional air pollution levels. Area sources can also be thought of as non-point sources, such as construction of housing developments, dry lake beds, and landfills.

Mobile Sources
A mobile source of air pollution refers to a source that is capable of moving under its own power. In general, mobile sources imply “on-road” transportation, which includes vehicles such as cars, sport utility vehicles, and buses. In addition, there is also a “non-road” or “off-road” category that includes gas-powered lawn tools and mowers, farm and construction equipment, recreational vehicles, boats, planes, and trains.

Agricultural Sources
Agricultural operations, those that raise animals and grow crops, can generate emissions of gases and particulate matter. For example, animals confined to a barn or restricted area (rather than field grazing), produce large amounts of manure. Manure emits various gases, particularly ammonia into the air. This ammonia can be emitted from the animal houses, manure storage areas, or from the land after the manure is applied. In crop production, the misapplication of fertilizers, herbicides, and pesticides can potentially result in aerial drift of these materials and harm may be caused.

Natural Sources
Although industrialization and the use of motor vehicles are overwhelmingly the most significant contributors to air pollution, there are important natural sources of “pollution” as well. Wildland fires, dust storms, and volcanic activity also contribute gases and particulates to our atmosphere.

Unlike the above mentioned sources of air pollution, natural “air pollution” is not caused by people or their activities. An erupting volcano emits particulate matter and gases; forest and prairie fires can emit large quantities of “pollutants”; plants and trees naturally emit VOCs which are oxidized and form aerosols that can cause a natural blue haze; and dust storms can create large amounts of particulate matter. Wild animals in their natural habitat are also considered natural sources of “pollution”. The National Park Service recognizes that each of these sources emits gases and particulate matter into the atmosphere but we regard these as constituents resulting from natural processes.

EE-Unit-II Earth’s Energy Balance

Earth’s Energy balance describes how the incoming energy from the sun is used and returned to space.  If incoming and outgoing energy are in balance, the earth’s temperature remains constant.

Essentially 100% of the energy that fuels the earth comes from the sun.  To maintain a constant global average temperature, all of the sun’s radiation that enters Earth’s atmosphere must eventually be sent back to space.  This is achieved through Earth’s energy balance.  Figure A depicts how the energy from the sun is absorbed, reflected, and emitted by the earth.

Solar energy is broken down into how much is used in what ways.


Figure A: Earth’s Energy Balance

100% of the energy entering earth’s atmosphere comes from the sun.

~50% of the incoming energy is absorbed by the earth’s surface i.e. the land and oceans.

~30% is directly reflected back to space by clouds, the earth’s surface and different gases and particles in the atmosphere (the earth’s albedo is 0.3 on average).

~20% is absorbed by the atmosphere and clouds.

The 70% of the sun’s energy that is absorbed by the earth’s surface, clouds, and atmosphere causes warming.  Any object or gas that has a temperature emits radiation outward, and this is ultimately re-radiated back into space.  This occurs 24 hours a day, and the energy is emitted as longwave radiation due to the characteristic temperatures of the earth and atmosphere.

Consider a stove, for example.  If you were cooking, you’d have the burner turned on so it would heat up.  The burner is like the earth and the heat source, be it gas or electric, is like the sun.  When you’re done cooking you turn off the burner, but it stays hot for a long while even after the heat source is gone.  Turning off the burner is like the sun going down.  Even though there is no more energy input, there is still energy output in the form of infrared radiation.  The burner stays hot because it’s still emitting the energy it absorbed earlier, just like the earth.  This time delay is sometimes called “thermal inertia.”

Most of the energy emitted from the earth’s surface does not go directly out to space.  This emitted energy is reabsorbed by clouds and by the gases in the atmosphere.  Some of it gets redistributed by convection.  Even more energy is released into the atmosphere through condensation.  The majority of the energy is reabsorbed by the greenhouse gases such as methane, nitrous oxide, ozone, carbon dioxide and water vapor.  These gases constantly emit the sun’s energy back into the atmosphere and keep the earth a habitable temperature.  Eventually, most of the energy makes its way back out to space and Earth’s energy balance is fairly well maintained.  The energy that doesn’t make its way out is responsible for global warming.

On a global scale, the atmosphere’s circulation and weather is an attempt to balance differences in solar energy that the earth receives across the globe.  Sunlight at the tropics is intense and direct and a lot of heating of land, atmosphere, and oceans occur there.  Sunlight in the polar regions is weak and indirect and does not do a good job of heating up the region.  Currents in wind and ocean water carry energy from the tropics toward the poles to help balance out the energy differences across the globe.

How does this relate to agriculture?

The daily change of temperature and the seasonal changes of weather are both effects of the delicate balance of incoming sunlight and outgoing longwave radiation.  On a clear and windless day, the temperature will rise following the course of the sun.  But even after noon, when solar radiation begins to decline, temperatures will continue to rise because the land is trying to reach a balance of incoming and outgoing energy.  In winter when days are short, the peak temperatures can occur 2-3 hours after noon.  In summer when days are longer, it can be 4 to 5 pm before the highest temperatures are reached.  The coolest temperatures usually occur just around sunrise when no sunlight has hit the ground for several hours.  Planning fieldwork late in the afternoon is more likely to result in ill effects of high temperatures and heat exhaustion in summer because of this thermal lag.

The seasons also reflect the attempts of the earth to balance incoming and outgoing energy on a larger scale.  Just like the lag of temperatures on a day, the hottest summer temperatures occur after the maximum sunlight has been reached.  In the Southeast this generally happens about a month after the summer solstice (when the sun is highest in the sky at noon).  Similarly, the coldest temperatures tend to occur about a month after the winter solstice in December.

EE-Unit-II Atmospheric Composition

The atmosphere contains many gases, most in small amounts, including some pollutants and greenhouse gases.  The most abundant gas in the atmosphere is nitrogen, with oxygen second.  Argon, an inert gas, is the third most abundant gas in the atmosphere.

Why do I care? The composition of the atmosphere, among other things, determines its ability to transmit sunlight and trap infrared light, leading to potentially long-term changes in climate.

The atmosphere is concentrated at the earth’s surface and rapidly thins as you move upward, blending with space at roughly 100 miles above sea level. The atmosphere is actually very thin compared to the size of the earth, equivalent in thickness to a piece of paper laid over a beach ball.  However, it is responsible for keeping our earth habitable and for producing weather.

Graphs of the overall atmospheric concentration and the relative percentages of trace gases.
Figure A

The atmosphere is composed of a mix of several different gases in differing amounts.  The permanent gases whose percentages do not change from day to day are nitrogen, oxygen and argon.  Nitrogen accounts for 78% of the atmosphere, oxygen 21% and argon 0.9%.  Gases like carbon dioxide, nitrous oxides, methane, and ozone are trace gases that account for about a tenth of one percent of the atmosphere.  Water vapor is unique in that its concentration varies from 0-4% of the atmosphere depending on where you are and what time of the day it is.  In the cold, dry artic regions water vapor usually accounts for less than 1% of the atmosphere, while in humid, tropical regions water vapor can account for almost 4% of the atmosphere.  Water vapor content is very important in predicting weather.

Greenhouse gases whose percentages vary daily, seasonally, and annually have physical and chemical properties which make them interact with solar radiation and infrared light (heat) given off from the earth to affect the energy balance of the globe.  This is why scientists are watching the observed increase in greenhouse gases like carbon dioxide and methane carefully, because even though they are small in amount, they can strongly affect the global energy balance and temperature over time.

EE-Unit-I Forest ecosystem

The entire assemblage of organisms (trees, shrubs, herbs, bacteria, fungi, and animals,including people) together with their environmental substrate (the surrounding air, soil, water,organic debris, and rocks), interacting inside a defined boundary. Forests and woodlandsoccupy about 38% of the Earth’s surface, and they are more productive and have greaterbiodiversity than other types of terrestrial vegetation. Forests grow in a wide variety of climates,from steamy tropical rainforests to frigid arctic mountain slopes, and from arid interiormountains to windy rain-drenched coastlines. The type of forest in a given place results from acomplex of factors, including frequency and type of disturbances, seed sources, soils, slopeand aspect, climate, seasonal patterns of rainfall, insects and pathogens, and history of humaninfluence.

Ecosystem concept

Often forest ecosystems are studied in watersheds draining to a monitored stream: thestructure is then defined in vertical and horizontal dimensions. Usually the canopy of the tallesttrees forms the upper ecosystem boundary, and plants with the deepest roots form the lowerboundary. The horizontal structure is usually described by how individual trees, shrubs, herbs,and openings or gaps are distributed. Wildlife ecologists study the relation of stand andlandscape patterns to habitat conditions for animals.

Woody trees and shrubs are unique in their ability to extend their branches and foliage skywardand to capture carbon dioxide and most of the incoming photosynthetically active solarradiation. Some light is reflected back to the atmosphere and some passes through leaves tothe ground (infrared light). High rates of photosynthesis require lots of water, and many woodyplants have deep and extensive root systems that tap stored ground water between rainstorms. Root systems of most plants are greatly extended through a relation between plantsand fungi, called mycorrhizal symbiosis.

The biomass of a forest is defined here as the mass of living plants, normally expressed as dryweight per unit area. Biomass production is the rate at which biomass is accrued per unit areaover a fixed interval, usually one year. If the forest is used to grow timber crops, productionmeasures focus on the biomass or volume of commercial trees. Likewise, if wildlife populationsare the focus of management, managers may choose to measure biomass or numbers ofindividual animals. Ecologists interested in the general responses of forest ecosystems,however, try to measure net primary production (Npp), usually expressed as gross primaryproduction (Gpp) minus the respiration of autotrophs (Ra).

Another response commonly of interest is net ecosystem production (NEP), usually expressed as where Rh is respiration of heterotrophs.

Productivity is the change in production over multiple years. Monitoring productivity isespecially important in managed forests. Changes in forest productivity can be detected only over very long periods.

Forested ecosystems have great effect on the cycling of carbon, water, and nutrients, andthese effects are important in understanding long-term productivity. Cycling of carbon, oxygen,and hydrogen are dominated by photosynthesis, respiration, and decomposition, but they arealso affected by other processes. Forests control the hydrologic cycle in important ways.Photosynthesis requires much more water than is required in its products. Water is lost back tothe atmosphere (transpiration), and water on leaf and branch surfaces also evaporates underwarm and windy conditions. Water not taken up or evaporated flows into the soil and eventuallyappears in streams, rivers, and oceans where it can be reevaporated and moved back overland, completing the cycle.

Forest plants and animals alter soil characteristics, for example, by adding organic matter,which generally increases the rate at which water infiltrates and is retained. Nutrient elementscycle differently from water and from each other.

Elements such as phosphorus, calcium, and magnesium are released from primary minerals inrocks through chemical weathering. Elements incorporated into biomass are returned to the soilwith litterfall and root death; these elements become part of soil organic matter and aremineralized by decomposers or become a component of secondary minerals. All elements canleave ecosystems through erosion of particles and then be transported to the oceans anddeposited as sediment. Deeply buried sediments undergo intense pressure and heat thatreforms primary minerals. Volcanoes and plate tectonic movements eventually distribute thesenew minerals back to land.

Nitrogen is the most common gas in the atmosphere. Only certain bacteria can form a specialenzyme (nitrogenase) which breaks apart N2 and combines with photosynthates to form aminoacids and proteins. In nature, free-living N2-fixing microbes and a few plants that can harborN2-fixing bacteria in root nodules play important roles controlling the long-term productivity offorests limited by nitrogen supply. Bacteria that convert ammonium ion (NH+4) to NO3(nitrifiers) and bacteria that convert NO3 back to N2 (denitrifiers) are important in nitrogen cycling as well.

Changes in the plant species of a forest over 10 to 100 years or more are referred to assuccession. Changes in forest structure are called stand development; changes in composition,structure, and function are called ecosystem development. Simplified models of succession and development have been created and largely abandoned because the inherent complexity of the interacting forces makes model predictions inaccurate.

Streams

One of the products of an undisturbed forest is water of high quality flowing in streams. Theecological integrity of the stream is a reflection of the forested watershed that it drains. Whenthe forest is disturbed (for example, by cutting or fire), the stream ecosystem will also bealtered. Forest streams are altered by any practices or chemical input that alter forestvegetation, by the introduction of exotic species, and by the construction of roads that increasesediment delivery to streams.

Vertebrates

Forest animals are the consumers in forest ecosystems. They influence the flow of energy andcycling of nutrients through systems, as well as the structure and composition of forests,through their feeding behavior and the disturbances that they create. In turn, their abundanceand diversity is influenced by the structure and composition of the forest and the intensity,frequency, size, and pattern of disturbances that occur in forests. Forest vertebrates make upless than 1% of the biomass in most forests, yet they can play important functional roles inforest systems.

Invertebrates

Invertebrates are major components of forest ecosystems, affecting virtually all forestprocesses and uses. Many species are recognized as important pollinators and seeddispersers that ensure plant reproduction. Even so-called pests may be instrumental inmaintaining ecosystem processes critical to soil fertility, plant productivity, and forest health.

Invertebrates affect forests primarily through the processes of herbivory and decomposition.They are also involved in the regulation of plant growth, survival, and reproduction; forestdiversity; and nutrient cycling. Typically, invertebrate effects on ecosystem structure andfunction are modest compared to the more conspicuous effects of plants and fungi. However,invertebrates can have effects disproportionate to their numbers or biomass.

Changes in population size also affect the ecological roles of invertebrates. For example, smallpopulations of invertebrates that feed on plants may maintain low rates of foliage turnover andnutrient cycling, with little effect on plant growth or survival, whereas large populations candefoliate entire trees, alter forest structure, and contribute a large amount of plant material andnutrients to the forest floor. Different life stages also may represent different roles. Immaturebutterflies and moths are defoliators, whereas the adults often are important pollinators.

Microorganisms

Microorganisms, including bacteria, fungi, and protists, are the most numerous and the mostdiverse of the life forms that make up any forest ecosystem. The structure and functioning offorests are dependent on microbial interactions. Four processes are particularly important:nitrogen fixation, decomposition and nutrient cycling, pathogenesis, and mutualistic symbiosis.

Nitrogen fixation is crucial to forest function. While atmospheric nitrogen is abundant, it isunavailable to trees or other plants unless fixed, that is, converted to ammonia (NH4), by eithersymbiotic or free-living soil bacteria.

Most microorganisms are saprophytic decomposers, gaining carbon from the dead remains ofother plants or animals. In the process of their growth and death, they release nutrients fromthe forest litter, making them available once again for the growth of plants. Their roles incarbon, nitrogen, and phosphorus cycling are particularly important. Fungi are generally mostimportant in acid soils beneath conifer forests, while bacteria are more important in soils with ahigher pH. Bacteria often are the last scavengers in the food web and in turn serve as food to ahost of microarthropods.

Microorganisms reduce the mass of forest litter and, in the process, contribute significantly tothe structure and fertility of soils as the organic residue is incorporated.

Some bacteria and many fungi are plant pathogens, obtaining their nutrients from living plants.Some are opportunists, successful as saprophytes, but capable of killing weakened orwounded plant tissues. Others require a living host, often preferring the most vigorous trees inthe forest. Pathogenic fungi usually specialize on roots or stems or leaves, on one species orgenus of trees.

Pathogenic fungi are important parts of all natural forest ecosystems. The forest trees evolvedwith the fungi, and have effective means of defense and escape, reducing the frequency ofinfection and slowing the rates of tissue death and tree mortality. However, trees are killed, andthe composition and structure of the forest is shaped in large part by pathogens.

Pathogens remove weak or poorly adapted organisms from the forest, thus maintaining thefitness of the population. Decay fungi that kill parts of trees or rot the heartwood of living treescreate an essential habitat for cavity-nesting birds and the other animals dependent on hollowtrees.

By killing trees, pathogens create light gaps in the forest canopy. The size and rate of light gapformation and the relative susceptibility of the tree species present on the site determine theecological consequences of mortality. Forest succession is often advanced as shade-toleranttrees are released in small gaps. Gaps allow the growth of herbaceous plants in the island oflight, creating habitat and food diversity for animals within the forest. In many forests,pathogens are the most important gap formers and the principal determinants of structure and succession in the long intervals between stand-replacing disturbances such as wildfires orhurricanes.

The fungus roots of trees, and indeed most plants, represent an intimate physical andphysiological association of particular fungi and their hosts. Mycorrhizae are the products oflong coevolution between fungus and plant, resulting in mutual dependency. Mycorrhizae areparticularly important to trees because they enhance the uptake of phosphorus from soils.Mycorrhizal fungi greatly extend the absorptive surface of roots through the network of externalhyphae.

EE-Unit-I Pond Ecosystem

A pond, a large earth depression where water collects, often has a serene, shallow depth composition to it. The ponds shallowness allows sunlight to penetrate to the bottom, which allows plants to grow. Pond plants either grow entirely underwater or partially on the surface. A minority of plants will also grow along the pond’s edge. Ponds eventually turn into a large plot of soil if left untreated by intervention. Ponds will support a large variety of animal and plant life, such as birds, crayfish, small fish, frogs, insects, turtles, protozoa, algae, and lily pads. Ponds usually regulate the same water temperature ranging from the water’s surface to the bottom. Ponds may freeze solid in colder climates.

A pond ecosystem, a basic unit in ecology formed from the cohabitation of plants, animals, microorganisms, and a surrounding environment, refers to a community of freshwater organisms largely dependent on each of the surviving species to maintain a life cycle. Ponds shallow water bodies barely reach 12 to 15 feet in-depth and allow the sun to penetrate to its bottom, allowing freshwater plants to grow. A pond ecosystem consists of algae, fungi, microorganisms, plants, and various fish, which may fall into three distinct classifications: producer, consumer, and decomposer. The pond’s natural cycle begins with the producers and then to the consumers before ending with the decomposers.

A pond’s ecosystem consists of abiotic environmental factors and biotic communities of organisms. Abiotic environmental factors of a pond’s ecosystem include temperature, flow, and salinity. The percentage of dissolved oxygen levels in a water body determines what kind of organisms will grow there. After all, fish need dissolved oxygen in order to survive; however, anaerobic bacteria will not thrive in an ecosystem pumped with dissolved oxygen. A water body’s salinity may also determine the different species present. For instance, marine organisms tolerate salinity, while freshwater organisms will not thrive when exposed to salt. In fact, freshwater ecosystems often have plant species present which will absorb salts that are dangerous for freshwater organisms.

A pond ecosystem consists of four habitats, including the shore, surface film, open water, and bottom water. The shore, depending on its rocky, sandy, or muddy composition, lures in various organisms. For instance, rocky shores may now allow plants to grow, while muddy or sandy shores attract grasses, algae, earthworms, snails, protozoa, insects, small fish, and microorganisms. The pond’s surface breeds excellent ground for water striders, marsh traders, free-floating organisms, and organisms that can walk on the surface of water. An open-water habitat permits sizable fish, plankton, phytoplankton, and zooplankton to grow. Phytoplankton includes a large variety of algae, while zooplankton refers to insect larvae, rotifers, small crustaceans and invertebrates. Fish feed on plankton, or tiny organisms. The bottom-water habitat varies depending upon the pond’s depth. Shallow ponds with sandy bottoms provide a nesting environment for earthworms, snails, and insects. Deep-ended ponds have muddy bottoms, which allow various microorganisms, such as flatworms, rat-tailed maggots, and dragonfly nymphs to reproduce and survive.

A pond’s ecosystem food chain has three basic trophic levels. The first trophic level represents the producer and autotrophs, such as phytoplankton and plants. Producers prepare their own food with the energy emitted from the sun through a process known as photosynthesis. The second trophic level consists of herbivores, such as insects, crustaceans, and invertebrates that inhabit the pond and consume the plants. The third trophic level comprises of carnivores, such as various sizes of fish, which feed on both the plants and herbivores atop the first and second trophic levels. Saprotrophic organisms, also known as decomposers located on the bottom of the food chain, help decompose dead organic matter, which further breaks down into carbon dioxide and essential nutrients, such as nitrogen, phosphorus, and magnesium. These nutrients supply the necessary life force for the first trophic level organisms to produce food for the second trophic organisms, which results in the perpetual flow of energy in the pond’s ecosystem.

EE-Unit-I Grassland ecosystem

A biological community that contains few trees or shrubs, is characterized by mixedherbaceous (nonwoody) vegetation cover, and is dominated by grasses or grasslike plants.Mixtures of trees and grasslands occur as savannas at transition zones with forests or whererainfall is marginal for trees. About 1.2 × 10⁸ mi2 (4.6 × 10⁷ km2) of the Earth’s surface iscovered with grasslands, which make up about 32% of the plant cover of the world. In NorthAmerica, grasslands include the Great Plains, which extend from southern Texas into Canada.The European meadows cross the subcontinent, and the Eurasian steppe ranges from Hungaryeastward through Russia to Mongolia; the pampas cover much of the interior of Argentina andUruguay. Vast and varied savannas and velds can be found in central and southern Africa and throughout much of Australia.

Grasslands occur in regions that are too dry for forests but that have sufficient soil water tosupport a closed herbaceous plant canopy that is lacking in deserts. Thus, temperategrasslands usually develop in areas with 10–40 in. (25–100 cm) of annual precipitation,although tropical grasslands may receive up to 60 in. (150 cm). Grasslands are found primarilyon plains or rolling topography in the interiors of great land masses, and from sea level toelevations of nearly 16,400 ft (5000 m) in the Andes. Because of their continental location theyexperience large differences in seasonal climate and wide ranges in diurnal conditions. Ingeneral, there is at least one dry season during the year, and drought conditions occurperiodically.

Significant portions of the world’s grasslands have been modified by grazing or tillage or havebeen converted to other uses. The most fertile and productive soils in the world have developedunder grassland, and in many cases the natural species have been replaced by cultivatedgrasses (cereals).

Different kinds of grasslands develop within continents, and their classification is based onsimilarity of dominant vegetation, presence or absence of specific dominant species, orprevailing climate conditions.

The climate of grasslands is one of daily and seasonal extremes. Deep winter cold does notpreclude grasslands since they occur in some of the coldest regions of the world. However, thesuccess of grasslands in the Mediterranean climate shows that marked summer drought is notprohibitive either. In North America, the rainfall gradient decreases from an annual precipitationof about 40 in. (100 cm) along the eastern border of the tallgrass prairie at the deciduous forestto only about 8 in. (20 cm) in the shortgrass prairies at the foothills of the Rocky Mountains. Asimilar pattern exists in Europe. Growing-season length is determined by temperature in thenorth latitudes and by available soil moisture in many regions, especially those adjacent todeserts. Plants are frequently subjected to hot and dry weather conditions, which are oftenexacerbated by windy conditions that increase transpirational water loss from the plant leaves.

Soils of mesic temperate grasslands are usually deep, about 3 ft (1 m), are neutral to basic,have high amounts of organic matter, contain large amounts of exchangeable bases, and arehighly fertile, with well-developed profiles. The soils are rich because rainfall is inadequate forexcessive leaching of minerals and because plant roots produce large amounts of organicmaterial. With less rainfall, grassland soils are shallow, contain less organic matter, frequentlyare lighter colored, and may be more basic. Tropical and subtropical soils are highly leached,have lower amounts of organic material because of rapid decomposition and more leachingfrom higher rainfall, and are frequently red to yellow.

Grassland soils are dry throughout the profile for a portion of the year. Because of their densefibrous root system in the upper layers of the soil, grasses are better adapted than trees tomake use of light rainfall showers during the growing season. When compared with forest soils,grassland soils are generally subjected to higher temperatures, greater evaporation, periodic drought, and more transpiration per unit of total plant biomass.

Throughout the year, flowering plants bloom in the grasslands with moderate precipitation, andflowers bloom after rainfall in the drier grasslands. With increasing aridity and temperature,grasslands tend to become less diverse in the number of species; they support more warm-season species; the complexity of the vegetation decreases; the total above-ground and below-ground production decreases; but the ratio of above-ground to below-ground biomass becomessmaller.

There are many more invertebrate species than any other taxonomic group in the grasslandecosystem. Invertebrates play several roles in the ecosystem. For example, many areherbivorous, and eat leaves and stems, whereas others feed on the roots of plants.Earthworms process organic matter into small fragments that decompose rapidly, scarab beetles process animal dung on the soil surface, flies feed on plants and are pests to cattle,and many species of invertebrates are predaceous and feed on other invertebrates. Soil nematodes, small non arthropod invertebrates, include forms that are herbivorous, predaceous,or saprophagous, feeding on decaying organic matter.

Most of the reptiles and amphibians in grassland ecosystems are predators. Relatively few birdspecies inhabit the grassland ecosystem, although many more species are found in theflooding pampas of Argentina than in the dry grasslands of the western United States. Theirrole in the grassland ecosystem involves consumption of seeds, invertebrates, and vertebrates;seed dispersal; and scavenging of dead animals.

Small mammals of the North American grassland include moles, shrews, gophers, groundsquirrels, and various species of mice. Among intermediate-size animals are the opossum, fox,coyote, badger, skunk, rabbit, and prairie dog; large animals include various types of deer andelk. The most characteristic large mammal species of the North American grassland is thebison, although many of these animals were eliminated in the late 1800s. Mammals includeboth ruminant (pronghorns) and nonruminant (prairie dogs) herbivores, omnivores (opossum),and predators (wolves).

Except for large mammals and birds, the animals found in the grassland ecosystem undergorelatively large population variations from year to year. These variations, some of which arecyclical and others more episodic, are not entirely understood and may extend over severalyears. Many depend upon predator–prey relationships, parasite or disease dynamics, orweather conditions that influence the organisms themselves or the availability of food, water,and shelter.

Within the grassland ecosystem are enormous numbers of very small organisms, includingbacteria, fungi, algae, and viruses. From a systems perspective, the hundreds of species of bacteria and fungi are particularly important because they decompose organic material,releasing carbon dioxide and other gases into the atmosphere and making nutrients available for recycling. Bacteria and some algae also capture nitrogen from the atmosphere and fix it into forms available to plants.

Much of the grassland ecosystem has been burned naturally, probably from fires sparked bylightning. Human inhabitants have also routinely started fires intentionally to remove predatorsand undesirable insects, to improve the condition of the rangeland, and to reduce cover forpredators and enemies; or unintentionally. Thus, grasslands have evolved under the influences of grazing and periodic burning, and the species have adapted to withstand these conditions. If burning or grazing is coupled with drought, however, the grassland will sustain damage that may require long periods of time for recovery by successional processes.

EE-Unit-I Nutrients Cycling

Inorganic nutrients occur in limited quantities and their loss to an ecosystem or retention and re-use is of great importance. The cycles of chemical elements in an ecosystem are known as nutrient cycles. If there is no loss to the ecosystem the cycle is said to be a ‘perfect cycle’ and if loss does occur the cycle is said to be ‘imperfect’. The decomposers play an important role in these cycles because they break down dead organisms and make the nutrient components available once more to other organisms.

The carbon and nitrogen cycle are two such cycles.

    • The Carbon Cycle
      All organic compounds contain carbon and the most important sources of all inorganic carbon is carbon dioxide in the atmosphere.
  • carbon dioxide is taken up by autotrophic organisms during photosynthesis and the carbon is incorporated into carbohydrates and other compounds , such as proteins and fats;
  • consumers (heterotrophic organisms) feed on plants, and their bodies assimilate carbon compounds derived from the plants;
  • all organisms, including plants, release carbon dioxide during respiration as a by product. (Fermentation releases of carbon dioxide);
  • when autotrophic and heterotrophic organisms die or lose body parts such as leaves, carbon dioxide is released as a result of decomposition;
  • combustion of dead animal and plant material also releases carbon dioxide;
  • under high pressures, dead plants and animals are carbonized, forming fossil-fuels, such as coal and crude-oil. These release carbon dioxide during combustion.


A Diagrammatic representation of the Carbon Cycle


  • The Nitrogen cycle
    Nitrogen is an element essential in all organisms, occurring in proteins and other nitrogenous compounds, e.g. nucleic acids. Although organisms live in nitrogen-rich environments (78% of the atmosphere is nitrogen) the gaseous forms of nitrogen can only be used by certain organisms. Free nitrogen must first be fixed into a useable form.
  • free nitrogen in the atmosphere is mainly fixed by two groups of bacteria, nl. Azotobacter and Clostridium. The nitrogen is then used to manufacture proteins in their bodies, when they die, their proteins are broken down by decomposers (mainly bacteria and other micro-organisms), and converted into ammonia (blue-green algae, cyanobacteria, can also be use free nitrogen from the atmosphere);
  • during electrical changes in the atmosphere(e.g. lightning), free nitrogen is fixed (combined) finally forming nitrate;
  • nitrates are taken up by plants which use them to manufacture proteins;
  • animals (herbivores) eat plants and convert plant proteins to animal proteins, while carnivores obtain their plant proteins by indirect means (by eating herbivores);
  • when plants and animals die, the proteins in their bodies are broken down into ammonia by decomposers. The process is known as ammonification;
  • ammonia is converted to nitrites by nitrite bacteria (Nitrosomonas and Nitrosococcus). Nitrites are again converted to nitrates by nitrate bacteria (Nitrobacter )This process is known as nitrification;
  • different types of bacteria are also able to break down nitrates, nitrites and ammonia which results in the release of nitrogen. This process is known asdenitrification.


A Diagrammatic Representation of the Nitrogen Cycle.

Water Cycle

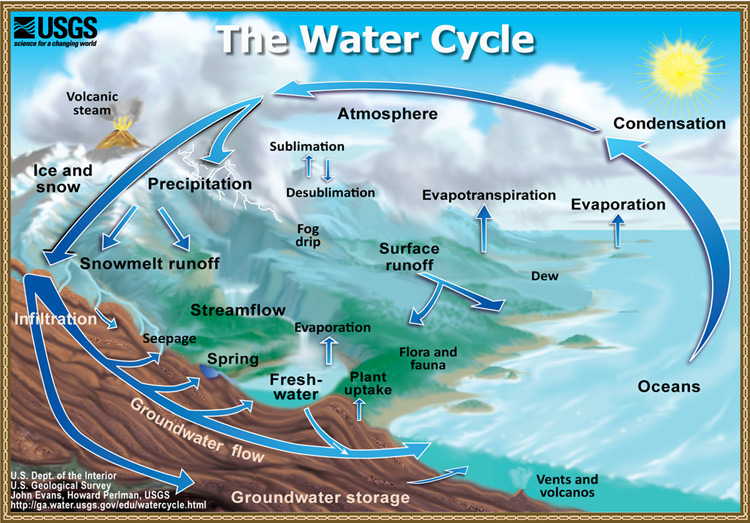
Earth’s water is always in movement, and the natural water cycle, also known as the hydrologic cycle, describes the continuous movement of water on, above, and below the surface of the Earth. Water is always changing states between liquid, vapor, and ice, with these processes happening in the blink of an eye and over millions of years.

The Water Cycle: Graphic showing the movement of water through the water cycle.

Global water distribution

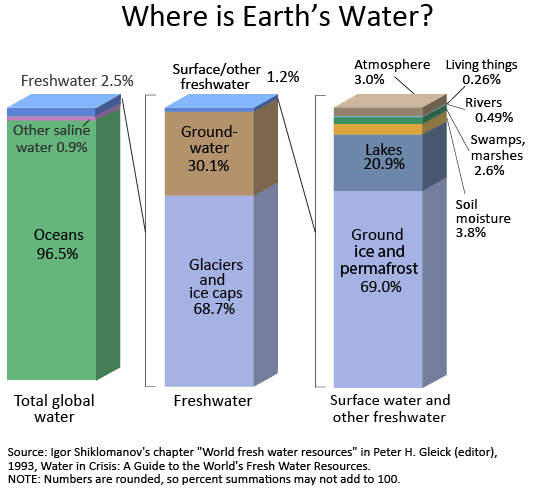
For an estimated explanation of where Earth’s water exists, look at the chart below. By now, you know that the water cycle describes the movement of Earth’s water, so realize that the chart and table below represent the presence of Earth’s water at a single point in time. If you check back in a thousand or million years, no doubt these numbers will be different!

Notice how of the world’s total water supply of about 332.5 million cubic miles of water, over 96 percent is saline. And, of the total freshwater, over 68 percent is locked up in ice and glaciers. Another 30 percent of freshwater is in the ground. Fresh surface-water sources, such as rivers and lakes, only constitute about 22,300 cubic miles (93,100 cubic kilometers), which is about 1/150th of one percent of total water. Yet, rivers and lakes are the sources of most of the water people use everyday.

Barcharts of the distribution of water on Earth

Source: Igor Shiklomanov’s chapter “World fresh water resources” in Peter H. Gleick (editor), 1993, Water in Crisis: A Guide to the World’s Fresh Water Resources (Oxford University Press, New York).

Where is Earth’s water?

For a detailed explanation of where Earth’s water is, look at the data table below. Notice how of the world’s total water supply of about 333 million cubic miles (1,386 million cubic kilometers) of water, over 96 percent is saline. And, of the total freshwater, over 68 percent is locked up in ice and glaciers. Another 30 percent of freshwater is in the ground. Thus, rivers and lakes that supply surface water for human uses only constitute about 22,300 cubic miles (93,100 cubic kilometers), which is about 0.007 percent of total water, yet rivers are the source of most of the water people use.

One Estimate of Global Water Distribution
(Numbers are rounded)
Water source Water volume, in cubic miles Water volume, in cubic kilometers Percent of
freshwater
Percent of
total water
Oceans, Seas, & Bays 321,000,000 1,338,000,000 96.5
Ice caps, Glaciers, & Permanent Snow 5,773,000 24,064,000 68.7 1.74
Groundwater 5,614,000 23,400,000 1.69
    Fresh 2,526,000 10,530,000 30.1   0.76
    Saline 3,088,000 12,870,000   0.93
Soil Moisture 3,959 16,500 0.05 0.001
Ground Ice & Permafrost 71,970 300,000 0.86 0.022
Lakes 42,320 176,400 0.013
    Fresh 21,830 91,000 0.26 0.007
    Saline 20,490 85,400 0.006
Atmosphere 3,095 12,900 0.04 0.001
Swamp Water 2,752 11,470 0.03 0.0008
Rivers 509 2,120 0.006 0.0002
Biological Water 269 1,120 0.003 0.0001
Source: Igor Shiklomanov’s chapter “World fresh water resources” in Peter H. Gleick (editor), 1993, Water in Crisis: A Guide to the World’s Fresh Water Resources (Oxford University Press, New York).

Oxygen Cycle

Oxygen, like carbon and hydrogen, is a basic element of life. In addition, in the form of O3, ozone, it provides protection of life by filtering out the sun’s UV rays as they enter the stratosphere. In addition to constituting about 20% of the atmosphere, oxygen is ubiquitous. It also occurs in combination as oxides in the Earth’s crust and mantle, and as water in the oceans.

Early in the evolution of the Earth, oxygen is believed to have been released from water vapor by UV radiation and accumulated in the atmosphere as the hydrogen escaped into the earth’s gravity. Later, photosynthesis became a source of oxygen. Oxygen is also released as organic carbon in CHO, and gets buried in sediments. The role of oxygen in life is describe in the unit onBiological Systems.

Figure O1. The Oxygen Cycle

Oxygen is highly reactive. A colorless, odorless gas at ordinary temperatures, it turns to a bluish liquid at -183° C. Burning or combustion is essentially oxidation, or combination with atmospheric oxygen. Figure O1 shows a very broad overview of oxygen cycling in nature. The environment of oxygen in numerous reactions make it hard to present a complete picture.

Oxygen is vital to us in many ways (beside the most obvious–for breathing). Water can dissolve oxygen and it is this dissolved oxygen that supports aquatic life. Oxygen is also needed for the decomposition of organic waste. Wastes from living organisms are “biodegradable” because there are aerobic bacteria that convert organic waste materials into stable inorganic materials. If enough oxygen is not available for these bacteria, for example, because of enormous quantities of wastes in a body of water, they die and anaerobic bacteria that do not need oxygen take over. These bacteria change waste material into H2S and other poisonous and foul-smelling substances. For this reason, the content of biodegradable substances in waste waters is expressed by a special index called “biological oxygen demand” (BOD), representing the amount of oxygen needed by aerobic bacteria to decompose the waste. 


EE-Unit-I Energy Flow in an Ecosystem

Nearly all of the energy that drives ecosystems ultimately comes from the sun. Solar energy, which is an abiotic factor, by the way, enters the ecosystem through the process of photosynthesis. You can learn more than you want to know about this process in the unit on photosynthesis. Or, you could just chat with your local botanist. Everyone has one, right? The organisms in an ecosystem that capture the sun’s electromagnetic energy and convert it into chemical energy are called producers. Not to be confused with these Producers.

The name is appropriate because producers make the carbon-based molecules, usually carbohydrates, that the rest of the organisms in the ecosystem, including you, consume. Producers include all of the green plants and some bacteria and algae. Every living thing on Earth literally owes its life to the producers. The next time you see a plant, it wouldn’t be a bad idea for you to thank it for its services…which, as you will learn in other units, go way beyond just supplying you with food.

After a producer has captured the sun’s energy and used it to grow yummy plant parts, other organisms come along and greedily gobble it up. These primary consumers, as they are called, exclusively feed on producers. If these consumers are human, we call them vegetarians. Otherwise, they are known as herbivores.

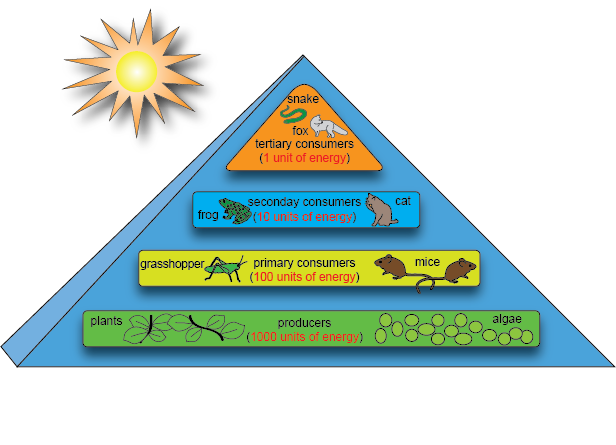
Primary consumers only obtain a fraction of the total solar energy—about 10%—captured by the producers they eat. The other 90% is used by the producer for growth, reproduction, and survival, or it is lost as heat. You can probably see where this is going. Primary consumers are eaten by secondary consumers. An example would be birds that eat bugs that eat leaves.Secondary consumers are eaten by tertiary consumers. Cats that eat birds that eat bugs that eat leaves, for instance.

At each level, called a trophic level, about 90% of the energy is lost. What a shame. So, if a plant captures 1000 calories of solar energy, a bug that eats the plant will only obtain 100 calories of energy. A chicken that eats the bug will only obtain 10 calories, and a human that eats the chicken will only obtain 1 calorie of the original 1000 calories of solar energy captured by the plant. When you think about this way, it would take 100 1000-calorie plants—those would be enormo plants, by the way—to produce a single 100-calorie piece of free-range chicken. You are now recalling all of the plants you have ever forgotten to water in your life and feeling really, really terrible about it, aren’t you?

The relationships among producers, primary consumers, secondary consumers, and tertiary consumers is usually drawn as a pyramid, known as an energy pyramid, with producers at the bottom and tertiary consumers at the top. You can see from the example above why producers are at the bottom of this pyramid. It takes a lot of producers for higher-trophic-level consumers, like humans, to obtain the energy they need to grow and reproduce.

This is the answer to the great mystery as to why there are so many plants on Earth. We will even spell it out for you because it is so important to understand: there are so many plants on Earth because energy flow through ecosystems is inefficient. Only 10% of the energy in one trophic level is ever passed to the next. So, there you have it. We hope you feel fulfilled.

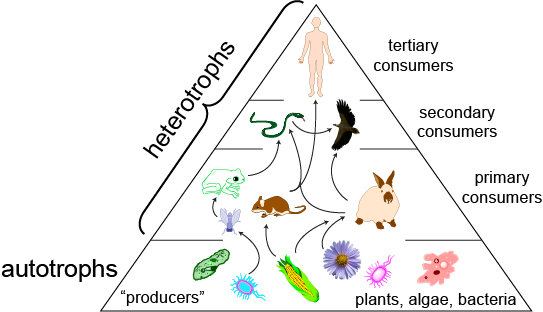
In addition to energy pyramid diagrams, ecosystem ecologists sometimes depict the relationship between trophic groups in a linear way, with arrows pointing from one organism to another. If there is only one producer, one primary consumer, one secondary consumer, and one tertiary consumer, this linear diagram is called a food chain. Food chains help ecologists and students visualize the interactions between organisms in an ecosystem. As always seems to be the case, it isn’t ever that simple. In fact, trophic interactions among organisms in an ecosystem are often really complex. It’s rare that an ecosystem only has one species at each trophic level. Usually, there are multiple producers that are eaten by multiple primary consumers. Some consumers eat different kinds of producers. Likewise, secondary consumers sometimes eat producers as well as primary consumers. These are known as omnivores.

These complex relationships are often depicted—if they can be figured out, that is—in a diagram called a food web. These diagrams can become messy indeed, depending on the size of the ecosystem and the number of interactions among trophic groups. If you like puzzles and biology, though, ecosystem ecology is the field for you.

Ecologists use food webs to better understand the intricate workings of the ecosystems they study. Understanding exactly who is eating whom can provide valuable information for conservation biologists as well. Such knowledge can aid in restoration efforts, species recovery projects, and preservation efforts, just to name a few instances. In any case, uncovering food webs goes a long way to understanding the first half of an ecosystem, the community.

Brain Snack

Most of our energy comes from domesticated animals and plants, but we are not the only organisms on the planet that farm. Insects, such as the fungal ants, feeding leaf clippings to a special symbiotic fungus and protect it from invasive pathogens. The ants tendto  their fungus just as humans tend to their gardens. You can watch an ant colony tend to their fungus in real time here.

EE-Unit-I Trophic levels

Trophic levels are the feeding position in a food chain such as primary producers, herbivore, primary carnivore, etc. Green plants form the first trophic level, the producers. Herbivores form the second trophic level, while carnivores form the third and even the fourth trophic levels. In this section we will discuss what is meant by food chains, food webs and ecological pyramids.

    • Food Chains.
      The feeding of one organism upon another in a sequence of food transfers is known as a food chain. Another definition is the chain of transfer of energy (which typically comes from the sun) from one organism to another. A simple food chain is like the following:

      rose plant — aphids — beetle — chameleon — hawk.

      In this food chain, the rose plant is the primary producer. The aphids are the primary consumers because they suck the juice from the rose plant. The beetle is the primary carnivore because it eats the aphids. The chameleon, a secondary carnivore, eats the beetle. The hawk is the tertiary carnivore because it eats the secondary carnivore, the chameleon. The hawk eventually dies and its remains are broken down by decay-causing bacteria and fungi.
      Except in deep-sea hydrothermal ecosystems, all food chains start with photosynthesis and will end with decay.

    • Food Webs
      In an ecosystem there are many different food chains and many of these are cross-linked to form a food web. Ultimately all plants and animals in an ecosystem are part of this complex food web.

  • Ecological Pyramids
    Trophic levels and the energy flow from one level to the next, can be graphically depicted using an ecological pyramid. Three types of ecological pyramids can usually be distinguished namely:

      • Number pyramid.
        It is easily understood that many grass plants are needed to feed fewer snails on which, in turn, even fewer chickens would be able to feed. This in turn requires only a few people to eat the chickens that ate the snails. The Number pyramid shows the number of organisms in each trophic level and does not take into consideration the size of the organisms and over-emphasizes the importance of small organisms. In a pyramid of numbers the higher up one moves, so each consecutive layer or level contains fewer organisms than the level below it.

        The Number Pyramid

      • Biomass pyramid.
        This pyramid indicates the total mass of the organisms in each trophic level. The size of the organism is over-emphasized and it can happen that the mass of level 2 is greater than that of level 1, because the productivity of level 1 is not taken into consideration. Thus an enormous mass of grass is required to support a smaller mass of buck, which in turn would support a smaller mass of lions.

        The Biomass Pyramid

    • Energy pyramid.
      The Energy pyramid indicates the total amount of energy present in each trophic level. It also shows the loss of energy from one trophic level to the next. An energy pyramid shows clearly that the energy transfer from one trophic level to the next is accompanied by a decrease due to waste and the conversion of potential energy into kinetic energy and heat energy. The energy pyramid is more widely used than the others because comparisons can be made between trophic levels of different ecosystem. It is, however, more difficult to compile an energy pyramid than it is compile the other types of pyramids.

The Energy Pyramid